고정 헤더 영역
상세 컨텐츠
본문
반응형
Logistic regression is a model specific to the relationship between a predictor and a response variable, and extends the concept of linear regression to a case where the dependent variable Y is categorical. The logistic regression model is a regression analysis model applied when the response variable is categorical. It does not require any assumptions about the independent variable, so it is possible in both continuous and discrete cases.
In this study, a logistic regression analysis model was used to predict future prices with the BDI index as a dependent variable.
1. Data Collection
For BDI data, 426 weekly data were extracted from January 2014 to April 1, 2022. The direction of this week's +/- returns compared to last week was set as the dependent variable, and data from lags 1 to 5 were input as independent variables.
| Date | BDI |
| 03-Jan-2014 | 2,074.50 |
| 10-Jan-2014 | 1,774.20 |
| 17-Jan-2014 | 1,391.60 |
| 24-Jan-2014 | 1,327.20 |
| 31-Jan-2014 | 1,155.80 |
| 07-Feb-2014 | 1,089.20 |
| 14-Feb-2014 | 1,095.00 |
| 21-Feb-2014 | 1,155.00 |
| 28-Feb-2014 | 1,220.20 |
| 07-Mar-2014 | 1,403.00 |
| 14-Mar-2014 | 1,508.00 |
The statistics (Min, Median, Mean, Max, etc.) of each independent variable and dependent variable are shown in the figure below.

2. Estimated model
The figure below shows the logistic regression model equation estimated using the above data.
Let's look at the results of the logistic regression model.
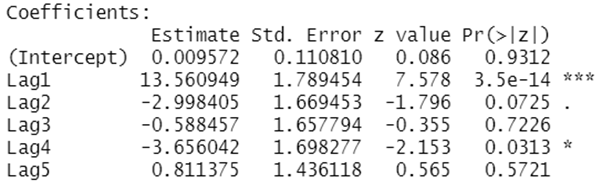
The following shows the results of running logistic regression using all variables as training data. When ignoring the p-value of the regression coefficient, the logistic equation estimated from the model using all variables is as follows.
Logit(Direction=Up)=0.009+13.56*Lag1-2.99*Lag2-0.588*Lag3-3.656*Lag4+0.811*Lag5
A positive (+) regression coefficient means that the higher the predictor value, the higher the probability that the BDI will rise.
If you look at Lag1, which has the lowest P-value, it means that if you get a +return one week ago, it is highly likely that this week will also go up. In the case of Lag2, if a positive return is obtained two weeks ago, it can be interpreted that this week is less likely to rise. The P-values of Lag1 and Lag4 both fall within 0.05, which is very meaningful to find a practical relationship between Lag parallax and the direction of BDI.
3. Classification performance evaluation
3-1. Check model prediction trends in validation data

I will examine the first five model directions in the validation data. 0.5 was defined as the baseline.
When the first one was higher than 0.5, the movement of BDI was actually classified according to the UP direction, and when all of 2 to 4 were higher than 0.5, the BDI direction was correctly classified as Up.
3-2. Confusion Matrix
| Type | Direction after 2021 | |
| Prediction | Down | Up |
| Down | 17 | 11 |
| Up | 10 | 25 |
That is, the accuracy of this logistic regression model was about 66.7%, and the error rate was 33.3%. It's not a high probability, but it seems that the odds are slightly better than tossing a coin.
4. Outlook for next week
The BDI direction of the next week (April 4-8) was predicted by inputting the above estimated logistic regression model. The conclusion is about 0.37 as shown below, and since it is less than 0.5, it can be seen that the probability of a decline is high.

I intend to add a logistic regression analysis model to 『BDI & SCFI Prediction』, which is predicted weekly.
Thanks.
728x90
'Forecast' 카테고리의 다른 글
| BDI & SCFI prediction (‘22/16W) (0) | 2022.04.17 |
|---|---|
| BDI & SCFI prediction (‘22/15W) (0) | 2022.04.10 |
| SCFI Prediction Using SVR Model (0) | 2022.04.09 |
| BDI & SCFI prediction (‘22/14W) (0) | 2022.04.04 |
| BDI & SCFI prediction (‘22/13W) (0) | 2022.03.30 |


댓글 영역