고정 헤더 영역
상세 컨텐츠
본문
As I announced last time, many of you know, but... I will share how the BDI index, which is not well known in detail, is formed and what the overall trend is like.
We hope that this analysis will help you understand the future bulk carrier market conditions and set the investment flow.
1. Composition of BDI
I will first explain the BDI, the benchmark index for bulk carriers. If you simply search on Google, it is also called BDI, which stands for Baltic Dry Index, and refers to the shipping rate index announced by the Baltic Shipping Exchange. It shows the market conditions of bulk carriers that carry raw materials such as iron ore, coal, and grain, and shows bulk freight rates and charter rates by ship type on 26 major routes around the world.
As defined above, the bulk carrier market can be estimated according to the flow of the BDI. The movement of the market will be covered a little later… I will explain how this index, called BDI and BDI, is composed and calculated.
The Baltic Dry Index (BDI) is a charter-weighted composite index of three linear types (Cape, Panamax and Supramax). It was first announced on January 4, 1985, starting with Index = 1,000. At the time of the initial announcement, it was called BFI (The Baltic Freight IndeX), and the composition/calculation formula was slightly changed to reflect the latest trends such as the enlargement of ships and changes in major routes.
The latest calculation formula currently reflected is as follows. It consists of the Baltic Capesize Index (40%), Baltic Panamax Index (30%), and Baltic Supramax Index (30%).
I will explain how the BDI number is calculated based on January 3, the first start date of 2023.

Average charter rate for 5 Cape routes: 13,561 * 40% (weighted) = 5,424
Average charter rate for Panamax 5 routes: 12,944 * 30% (weight) = 3,883
Average charter rate for Supramax 10 routes: 10,646 * 30% (weight) = 3,194
The sum of the three alignments is 12,501, which is multiplied by 10% (the multiplier) to give the final BDI of 1,250.
2. Cape Index Construction
First, I'll show you the main routes that Cape ships travel.

The figure above shows the main routes (charter fees) of Cape ships.
C8 is a round-trip Atlantic route, C9 is a Europe-Far East Asia route, C10 is an Australia-China Pacific round-trip route, C14 is a Brazil-China round-trip route, and C16 is a Far East Asia-Europe route.
The indices announced daily from Cape Linear are as follows, and the table summarizes the indices announced on January 3rd.

C2, C3, C5, C7 are based on fares on the same route, and the six indicators below are based on charter rates. In other words, C5 and C10 are the same on the same route, but one is the fare and the other is the charter rate.
The charter rate unit is $/Day, and the indices are organized from C8 to C17, and each weight is multiplied again. The final sum of the multiplied weights is 13,561, which is the average charter rate for the five Cape routes.
In addition, I think you may have a question, then, I understand the BDI, but how are indices such as BCI and BPI calculated? no see. My acquaintances also say that BDI = BCI + BPI + BSI
As of January 3rd, BDI(1,250) ≠ BCI(1,635) + BPI(1,438) + BSI(968).
In other words, there is a separate Cape linear index calculation formula called BCI, and the calculation formula is as follows.

If you multiply the multiplier by the charter rate for each vessel and add it again, you get the BCI value.
Long explanation. To sum up, it is worth knowing that there are indices such as BCI and BPI in addition to BDI. However, I think there is no difficulty in understanding market conditions and patterns by looking at the average charter rates for the five Cape routes, which are mainly linked to BDI calculations.
3. Panamax Index Construction
Let's also take a look at the routes that Panamax ships use.

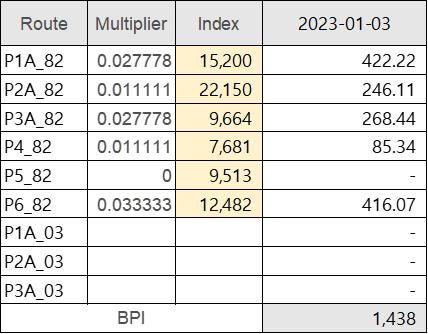
P1A is a round-trip route to the Atlantic Ocean, P2A is a Europe-Far East Asia route, P3A is a round-trip Pacific route, P4 is a Far East Asia-Australia-North Europe route, P5 is a South China-Indonesia round-trip route, and P6 is a Singapore-Brazil-Far East Asia route. .

Please refer to the figure below for the BPI calculation formula.

4. Supramax Index Construction

S1B is the Mediterranean-Far East Asia route, S1C is the US Gulf-Far East Asia route, S2 is the China-Australia-North America Pacific round-trip route, S3 is the China-West Africa route, S4A is the US Gulf-Nordic route, S4B is the North Europe-US Gulf route, S5 West Africa-South America-China, S8 is South China-Indonesia-East Indies, S9 is West Africa-South America-North Europe, and S10 is South China-Indonesia.
It is worth remembering that the US Gulf Coast is a grain export zone, and even on the Supramax route, there are characteristics of routes according to items such as coal (S10 route) and grain (S1C, S4A route).

Please also refer to the BSI calculation formula.

5. Bulk carrier market volatility
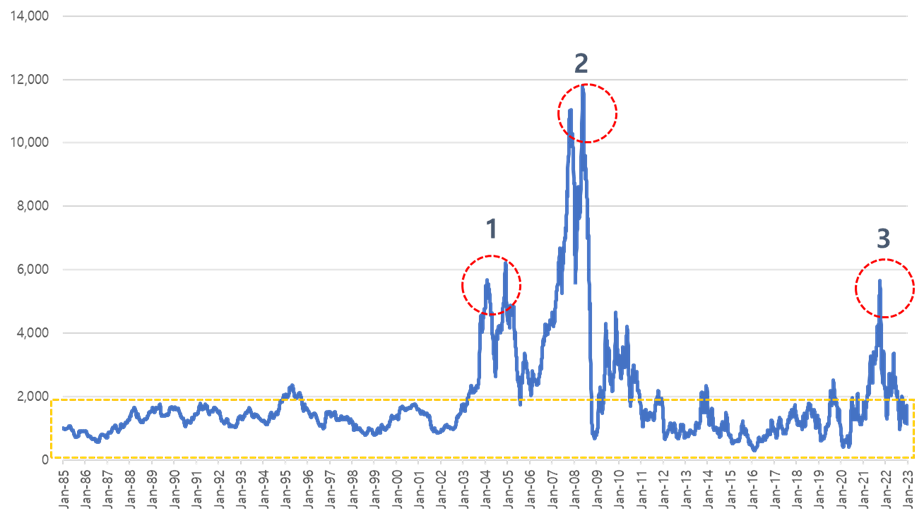
I explained the BDI calculation formula and how it was structured earlier, but let's move a little bit and look at the BDI trend. The most recent data from 1985 to January 23, when it was first published, was included.

This is a BDI graph that anyone interested in bulk carriers should have seen at least once. The highest value was 11,793 recorded on May 20, 2008, and the lowest value was 290 recorded on February 10 and 11, 2016 respectively.
Most of the BDI moved below 2,000 except for the three big events circled in red. The first BDI rise is related to China's economic development. China's GDP growth rate was 2003 (10.0%), 2004 (10.1%), 2005 (11.4%), 2006 (12.7%), and 2007 (14.2%). The rapidly developing Chinese economy sucked in global raw materials like a black hole, and at the time, the development of Chinese ports was slow, and ship demurrage increased, limiting supply and exploding demand. For this reason, the BDI experiences its first big jump above the 6,000 level.
The second rise and fall occurred at the same time. Competitive chartering, fueled by China's economic development and the optimistic outlook of shipping lines, pushed the BDI competitively up. However, soon after, the US subprime mortgage burst and the situation plunged, recording 663 points on December 5, 2008, less than 7 months later. In just 7 months, the decline was -94.4%.
The BDI's third rise, which has since bottomed out, is the most recent at 5,650 on October 7, 2021. The biggest reasons for the increase can be attributed to the increase in maritime cargo volume due to economic stimulus measures in each country after Covid-19, the increase in tonmiles of iron ore due to the political dispute between China and Australia, and the increase in port demurrage.
In investing, there are ways to detect the rising pattern of the BDI and invest in shipping lines, or to invest in FFA (Freight Futures Trading), which will be covered later in another chapter.
In the final overview chapter of What is a bulk carrier?, we will prepare matters related to fleets, such as supply volume by type, fleet status by age, and dismantled ships.
thank you
'Dry Bulk' 카테고리의 다른 글
| What is a bulk carrier? ③ Focusing on tonnage by type, aging fleet, and backlog of orders (0) | 2023.02.11 |
|---|---|
| What is a bulk carrier? ① Focusing on ship types and cargo volume (0) | 2023.02.01 |
| BDI Prediction with Regression (0) | 2022.11.29 |
| Bulk carrier market outlook(2023/2024) (0) | 2022.11.04 |
| Bulk Carrier Shipping Market (‘22/30W) (0) | 2022.07.26 |


댓글 영역