고정 헤더 영역
상세 컨텐츠
본문
반응형
1. Check the fleet list
It will be reborn as an integrated shipping company with 68 VLCCs, 56 Suezmax, 20 LR2-type product ships/Aframax, and 2 FSO (floating oil storage facilities).
2. Check the current tanker market conditions
It would be good to refer to the previous analysis of prospects for the four types of ships. To reiterate, the oil tanker market situation in 2022 shows a demand growth rate of 3.22% and a supply growth rate of 3.19%, slightly exceeding the supply growth rate. Also, in 2023, demand growth rate is 2.47% and supply growth rate is 1.17%, which is expected to have a positive impact on the market conditions as demand greatly exceeds supply growth rate.
Ref) [IMPORTANT] Inspection of market conditions by ship type/year(Forecast) (‘22/June) (tistory.com)
[IMPORTANT] Inspection of market conditions by ship type/year(Forecast) (‘22/June)
The supply and demand status of container ships/dry bulk carriers/tankers/LNG carriers analyzed in March has been updated. This report is updated on a quarterly basis to provide a macro investmen..
shippingmarket.tistory.com
3. Future market outlook

The VLCC market is having its worst year ever. VLCC, which generated a profit of 170,000$ (Daily) in April 2020, is in the profit/loss section where it loses if it operates at -19,400$ (Daily) in June 22nd. Of course, depending on the oil price, there will not be many negatives in actual operation, but in terms of the index, it is in the worst section ever.

What is encouraging is that orders for VLCC vessels are near the lowest level. As of July 22nd, VLCC orderbook is 7.66%, that is, only about 7.6% of the total VLCC fleet is ordered, and the ship will be delivered over the next three years. It can be seen that the supply side is very limited in terms of supply and demand factors.
As another example, ships that received orders up to 50.14% in 2009 acted the most as a factor in the decline in VLCC rates until mid-to-late 2010.
4. Investment Strategy
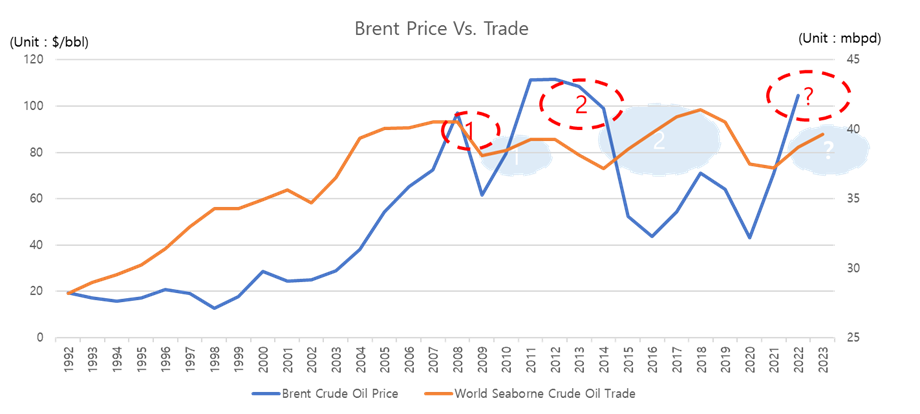
The blue line is the Brent Crude Oil Price (Left) and the orange line is the table showing Crude Oil Trade (Right). This figure aims to examine the relationship between oil price and trade volume.

As shown in the table above, the correlation between the two variables is very high at 0.69. However, this analysis is intended to focus on how prices and trade volumes have progressed with a time lag at a specific point in time.
If you look at red circle number 1, Brent crude, which had soared to $96.9 in 2008, fell for the second year in a row due to subprime mortgages. Looking at the blue circle No. 1, it can be seen that the cargo volume increased from 2009 to 2012 (3 years) with a time lag.
If you look at the red circle #2, you can see that oil prices have plummeted from the peak in 2012 to 2015. If you look at the blue circle #2, you can see that the volume of cargo increased from 2014 to 2018 (4 years) with a time lag.
Now, as we enter the second half of FY22, international oil prices are falling rapidly. Oil-producing countries that have benefited from the surge in international oil prices from Covid-19 will be saddened by the rapidly falling oil price. Considering the fiscal balance of oil-producing countries, it is impossible to increase the cargo volume abruptly.
Therefore, I view the future oil tanker market conditions and Euronav's outlook very positively.
728x90
'Special Report' 카테고리의 다른 글
| Regarding the IMO's EEXI regulations (Feat. Maersk) (0) | 2022.10.24 |
|---|---|
| VLCC market analysis (0) | 2022.08.09 |
| The impact of OSRA_2022 on the shipping market (0) | 2022.07.01 |
| ILWU Issue (Updated on 6/28) (0) | 2022.06.29 |
| ILWU Issue (Updated on 6/15) (0) | 2022.06.16 |


댓글 영역