고정 헤더 영역
상세 컨텐츠
본문
반응형
In the 24th week, BDI and SCFI predicted values and actual values are compared and tested.
1. Last Week’s forecasts
1-1. BDI, Actual Vs. Predicted
| Date | Last week Forecast | Actual BDI | MAPE(%) | Accuracy(%) |
| ‘22/23W(6/6~10) | 2,241.961 | 2,429.20 | 7.7% | 92.3% |
1-2. SCFI, Actual Vs. Predicted
| Date | Last week Forecast | Actual SCFI | MAPE(%) | Accuracy(%) |
| ‘22/23W(6/6~10) | 4,210.933 | 4,233.31 | 0.5% | 99.5% |
The prediction accuracy of BDI and SCFI was 92.3% and 99.5%, respectively. The predicted value (2,241.961) and actual value (2,429.20) of BDI, and predicted value (4,210.933) and actual value of SCFI (4,233.31) all achieved high accuracy and trend. The BDI did not fall as much as the forecast, but the extent of the decline increased as the second half of the week (Thursday, Friday) went. The SCFI rose for the fourth week in a row and it appears that support has been established to some extent.
The BDI average MAPE value for the latest 11 predictions is 5.1% and the prediction rate is 94.9%, and the SCFI average MAPE value is 0.6% and the prediction rate is 99.4%.
2. BDI forecast
2-1. ARIMA, Time series analysis
For the BDI index forecast, I used weekly data (436 pieces) from January 3, 2014 to Jun 10, 2022 to predict the freight for three weeks in the future.
| Date | Forecast | Trend(WoW) |
| ‘22/24W(6/13~17) | 2,411.164 | ↓ |
| ‘22/25W(6/20~24) | 2,444.151 | ↗ |
| ‘22/26W(6/27~7/1) | 2,547.139 | ↑ |
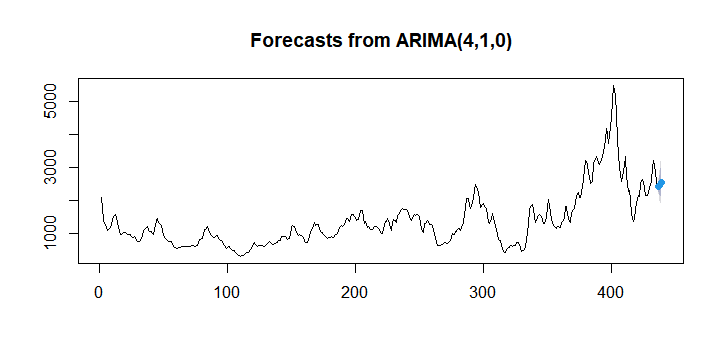
As shown in the table and figure above, BDI (as of 6/10: 2,429.20) fell -6.2% compared to last week (as of 6/3: 2,590.00). Even though it was a big drop, it is unlikely that there will be a steeper drop as it has already plunged -14% over the past week. Therefore, in my personal opinion, the bottom line of BDI is being seen, and the timing of the investment (Buy) is seen.
According to the BDI prediction result of the ARIMA model, the market will rebound next week, but the BDI will rise at the 25th/26th week.
Ref) BDI & SCFI prediction (‘22/23W) (tistory.com)
BDI & SCFI prediction (‘22/23W)
In the 23rd week, BDI and SCFI predicted values and actual values are compared and tested. 1. Last Week’s forecasts 1-1. BDI, Actual Vs. Predicted Date Last week Forecast Actual B..
shippingmarket.tistory.com
2-2. Logistic regression analysis
Logistic regression analysis was performed with the same data predicted by the ARIMA model previously.

The expected trend for next week is 0.048, well below the baseline of 0.5. It is not known how much the decline will be, but the direction indicates that the decline is certain. When combined with the ARIMA model, it is expected that there will be a decline, but the extent of the decline will not be large.
3. SCFI Outlook
3-1. ARIMA, Time series analysis
For the SCFI forecast, I used weekly data (634 pieces) from October 16, 2009 to Jun 10, 2022 to predict the future freight for three weeks.
| Date | Forecast | Trend(WoW) |
| ‘22/24W(6/13~17) | 4,241.340 | ↗ |
| ‘22/25W(6/20~24) | 4,242.159 | → |
| ‘22/26W(6/27~7/1) | 4,241.826 | ↘ |

As shown in the table and figure above, SCFI (as of 6/10: 4,233.31) rose for 4 consecutive weeks following last week (as of 6/3: 4,208.01). The SCFI change rate is 0.3% -> 0.78% -> 0.6%, which is still not a significant increase. However, the fact that it is the fourth consecutive week of rise is expected to show a strong trend at least at the current SCFI level rather than a further decline for the time being.
3-2. Logistic regression analysis

The predicted value of SCFI's logistic regression analysis model was 0.390, which predicted the next week's SCFI's freight direction to be down. Unlike the rise in the ARIMA model, logistic regression still places more weight on the likelihood of a decline than an upturn.
3-3. SVR model
In the SVM model, SCFI freight rates are expected to decline next week, but turn upward from the 25th week. All three models of SCFI have slightly different prediction results, but it does not seem likely to move significantly up or down in any direction from the current large scale.
| Date | Forecast | Trend(WoW) |
| ‘22/24W(6/13~17) | 4,186.481 | ↓ |
| ‘22/25W(6/20~24) | 4,214.564 | ↗ |
| ‘22/26W(6/27~7/1) | 4,242.084 | ↗ |

Thanks.
728x90
'Forecast' 카테고리의 다른 글
| BDI & SCFI prediction (‘22/25W) (0) | 2022.06.19 |
|---|---|
| BDI Prediction Using Holt-Winters Additive Exponential Smoothing (0) | 2022.06.13 |
| BDI & SCFI prediction (‘22/23W) (0) | 2022.06.05 |
| BDI & SCFI prediction (‘22/22W) (0) | 2022.05.29 |
| BDI & SCFI prediction (‘22/21W) (0) | 2022.05.22 |


댓글 영역