고정 헤더 영역
상세 컨텐츠
본문 제목
Analysis of causality of BDI and increase in congestion due to Covid-19 pandemic
본문
반응형
1. Introduction
In this study, as factors that affect BDI, a representative dry cargo freight rate index, the causal relationship between the supply-side capacity and congestion ratio and the demand-side cargo volume of iron ore and coal, the major cargoes, is analyzed to understand the causal relationship.
Next, whether the occurrence of congestion due to regulations such as strengthening quarantine at the port due to the COVID-19 pandemic and the reduction of work efficiency due to the infection of cargo workers with infectious diseases, and the closure of ports in the case of a confirmed case in China affects the rise of the tramp market. In addition, the purpose is to help predict the direction of the shipping market and the shipping market in the post-corona era when the congestion rate in ports is reduced due to the With Corona policy.
2. Data
2-1. Data extract
In this study, using monthly time series data from January 2016 to July 2021, we analyze the causal relationship between the factors on the supply and demand side that are expected to affect the dry freight rate index (BDI). In particular, it is analyzed whether the congestion situation, which has been increasing since the pandemic due to the delay in working hours due to infectious diseases, is affecting the tramp shipping market, which has recently skyrocketed.
2-2. Variable Description
As the dependent variable, monthly BDI data published by Clarkson was selected. As explanatory variables on the demand side, the volume and price of iron ore and coal, the major cargoes of Cape and Panamax ships, and the price of Japanese plate were selected, and data provided by Clarkson was used. For the analysis on a monthly basis, the volume of trade was taken as Australia's iron ore exports, which account for most of the import and export volume, and China's imports of raw coal and power generation coal. As an explanatory variable on the supply side, the capacity of Cape and Panamax, which are expected to have the most impact, was selected. In addition, the effect of the congestion rate was analyzed by using the Congestion Index provided by Clarkson as a supply-side variable for the ratio of the cape and Panamax vessels waiting out of the total capacity of the cape and Panamax ships.
| Variable | Obs | Mean | Std. Dev. | Min | Max |
| BDI(BDI) | 67 | 1247.97389 | 603.1958344 | 306.90476 | 3187.95455 |
| Fleet(FLEET) | 67 | 544.2612487 | 30.4651999 | 502.99828 | 602.97348 |
| Congestion(CGTN) | 67 | 30.25460315 | 1.500256004 | 26.67553182 | 33.72505697 |
| Iron Ore export (AUIOEX) |
67 | 69691.76119 | 5108.141452 | 56776 | 80746 |
| C.coal import of China (CNCCIM) |
67 | 3292.141881 | 1093.499468 | 919.306 | 5563.677 |
| T.coal improt of China (CNTCIM) |
67 | 16031.11797 | 4300.273902 | 5764.306 | 31872.09 |
| Iron ore price(IOP) | 67 | 91.69570328 | 39.9314168 | 41.25238 | 214.4 |
| T.coal Price(TCP) | 67 | 82.78089552 | 22.35472357 | 49.8 | 152 |
| Japan steel plate price (PLTP) |
67 | 549.8507463 | 111.6700366 | 360 | 950 |
2-3. Augmented Dicky-Fuller test
| Variable | Lag | Test Statistic | P-value | Difference | |
| Test Statistic | P-value | ||||
| BDI | 4 | -2.9812 | 0.1768 | -5.0108 | 0.01 |
| FLEET | 4 | -0.84613 | 0.9529 | -6.3437 | 0.01 |
| CGTN | 4 | -4.134 | 0.01 | - | - |
| AUIOEX | 4 | -4.1589 | 0.01 | - | - |
| CNCCIM | 4 | -3.252 | 0.08699 | -4.7219 | 0.01 |
| CNTCIM | 4 | -3.872 | 0.0208 | -5.4845 | 0.01 |
| IOP | 4 | 0.5811 | 0.99 | -8.4131 | 0.01 |
| TCP | 4 | -0.92399 | 0.9431 | -6.4772 | 0.01 |
| PLTP | 4 | -2.1703 | 0.506 | -4.3872 | 0.01 |
As a result of the analysis, only two variables, CGTN and AUIOEX, were judged to be stable time series. Therefore, the original time series can be used for both variables as it is, but the other variables are different and are converted into a stable time series before use. BDI was first difference, FLEET was second difference, CNCCIM and CNTCIM were first difference, IOP, TCP, and PLTP were second difference, respectively, and converted into a stable time series.
2-4. Granger Causality Test
To test for causality between variables, a Granger causality test was performed. As a result of the analysis, it was confirmed that FLEET, CGTN, and PLTP variables had causality as the null hypothesis was rejected at the significance level as variables affecting BDI. It can be explained that the past values of independent variables with causality affect the current BDI index. Other variables that do not show causality should be excluded from the VAR model later. The results of the Granger causality test are shown in the table below.
| Variable | Lag | F-statistic | p-value |
| FLEET-> BDI | 1 | 4.4268* | 0.03951 |
| CGTN->BDI | 3 | 2.5367* | 0.06584 |
| AUIOEX->BDI | 3 | 0.9484 | 0.4235 |
| CNCCIM->BDI | 3 | 1.2954 | 0.285 |
| CNTCIM->BDI | 3 | 0.6196 | 0.6052 |
| IOP->BDI | 3 | 0.1366 | 0.9378 |
| TCP->BDI | 3 | 0.3562 | 0.7848 |
| PLTP->BDI | 2 | 3.3324* | 0.04266 |
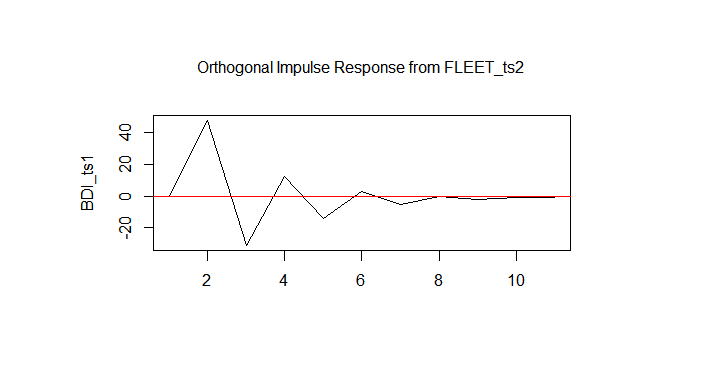
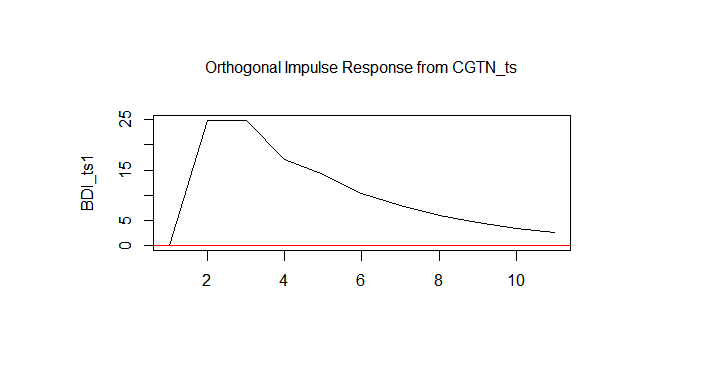
2-5. Impulse response
The result of the impulse response is as follows. The impact of 1 unit of standard deviation of total dose (FLEET) of Cape and Panamax occurred at time t showed a positive (+) response to the initial BDI, peaked in the second stage, and then gradually decreased. The impact of 1 unit standard deviation of body line rate (CGTN) of Cape and Panamax occurred at time t showed a positive (+) response to BDI, peaked in the 2nd and 3rd phases, and then gradually decreased. Finally, the shock of 1 standard deviation of Japanese heavy plate price (PLPT) showed a positive (+) response to BDI in the early stage and recorded the highest in the 3rd period.

3. Conclusion
It was confirmed that congestion, which was the initial study objective, had a positive effect on the BDI index.
In the case of the bulk carrier market, as the ship exhaust gas carbon emission reduction regulations that will be in effect from 2023 and the delivery time of new ships ordered in 2021 are after 2023, it is expected that the capacity will be insufficient until 2022. Even if the shipping market deteriorates slightly, the profitability of bulk ships is expected to remain at a level that is not bad unlike the recession since 2008.
728x90


댓글 영역