고정 헤더 영역
상세 컨텐츠
본문
반응형
In the 19th week, BDI and SCFI predicted values and actual values are compared and tested.
1. Last Week’s forecasts
1-1. BDI, Actual Vs. Predicted
| Date | Last week Forecast | Actual BDI | MAPE(%) | Accuracy(%) |
| ‘22/18W(5/2~6) | 2,511.710 | 2,564.75 | 2.1% | 97.9% |
1-2. SCFI, Actual Vs. Predicted
| Date | Last week Forecast | Actual SCFI | MAPE(%) | Accuracy(%) |
| ‘22/18W(5/2~6) | 4,164.260 | 4,163.74 | 0.1% | 99.9% |
The prediction accuracy of BDI and SCFI was 97.9% and 99.9%, respectively. The predicted values (2,511.710) and actual values (2,564.75) of BDI, and predicted values (4,164.260) and actual values (4,163.74) of SCFI all achieved Trend and Accuracy. The average BDI MAPE value for the last five predictions is 3.1% and the prediction rate is 96.9%, and the SCFI average MAPE value is 0.8% and the prediction rate is 99.2%.
2. BDI forecast
2-1. ARIMA, Time series analysis
For the BDI index forecast, I used weekly data (431 pieces) from January 3, 2014 to May 06, 2022 to predict the freight for three weeks in the future.
| Date | Forecast | Trend(WoW) |
| ‘22/19W(5/9~13) | 2,623.855 | ↑ |
| ‘22/20W(5/16~20) | 2,620.604 | → |
| ‘22/21W(5/23~27) | 2,603.557 | ↘ |
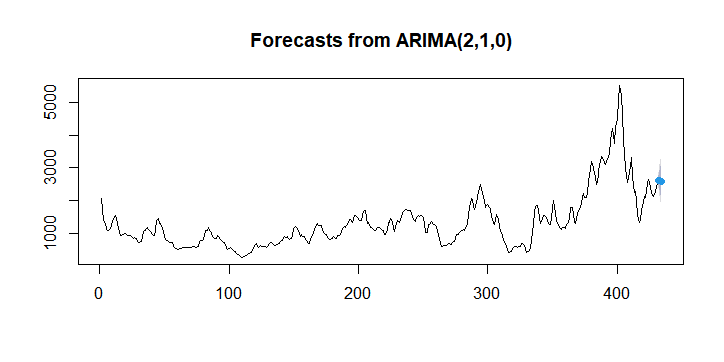
As shown in the table and figure above, BDI (as of May 6th: 2,564.75) increased by 6.9% compared to last week (as of April 29: 2,398.40), showing a clear upward trend. With the Cape market driving the overall rise in BDI, Panamax and Supramax are also strong. In light of this, a gradual rise is expected, but there is a short-term sharp rise, so I think the 19W, 20W, and 21W will be a resting market.
Ref) BDI & SCFI prediction (‘22/18W) (tistory.com)
BDI & SCFI prediction (‘22/18W)
In this article, I'm going to compare the superiority of the models by periodically predicting/verifying the freight rates using ARIMA and logistic regression models. 1. Last Week’s forecasts..
shippingmarket.tistory.com
2-2. Logistic regression analysis
Logistic regression analysis was performed with the same data predicted by the ARIMA model previously.


The expected trend for next week is 0.819, which is very high compared to the baseline 0.5. Therefore, the 19W dry bulk market is expected to rise following last week's upward trend with high probability.
3. SCFI Outlook
3-1. ARIMA, Time series analysis
For the SCFI forecast, I used weekly data (629 pieces) from October 16, 2009 to May 06, 2022 to predict the future freight for three weeks.
| Date | Forecast | Trend(WoW) |
| ‘22/19W(5/9~13) | 4,155.752 | ↘ |
| ‘22/20W(5/16~20) | 4,147.026 | → |
| ‘22/21W(5/23~27) | 4,138.829 | → |

As shown in the table and figure above, the SCFI (as of May 6th: 4,164.74) is expected to show a continuous decline following last week's forecast. The quiet cascading decline has come as a result of 16 consecutive weeks of decline from the peak. When will the container market rebound that everyone expects? Although the weight of a rebound is still evident, if a recession occurs in the future due to a sharp rise in interest rates throughout the year, we cannot rule out the possibility that freight rates will maintain the current trend due to a decrease in container shipments.
3-2. Logistic regression analysis


The results of the logistic regression analysis model of SCFI are also the same as the ARIMA values. With a predicted value of 0.376, the next week's SCFI freight direction is predicted to decline.
Thanks.
728x90
'Forecast' 카테고리의 다른 글
| BDI & SCFI prediction (‘22/21W) (0) | 2022.05.22 |
|---|---|
| BDI & SCFI prediction (‘22/20W) (0) | 2022.05.16 |
| BDI & SCFI prediction (‘22/18W) (0) | 2022.05.02 |
| BDI & SCFI prediction (‘22/17W) (0) | 2022.04.23 |
| BDI & SCFI prediction (‘22/16W) (0) | 2022.04.17 |


댓글 영역